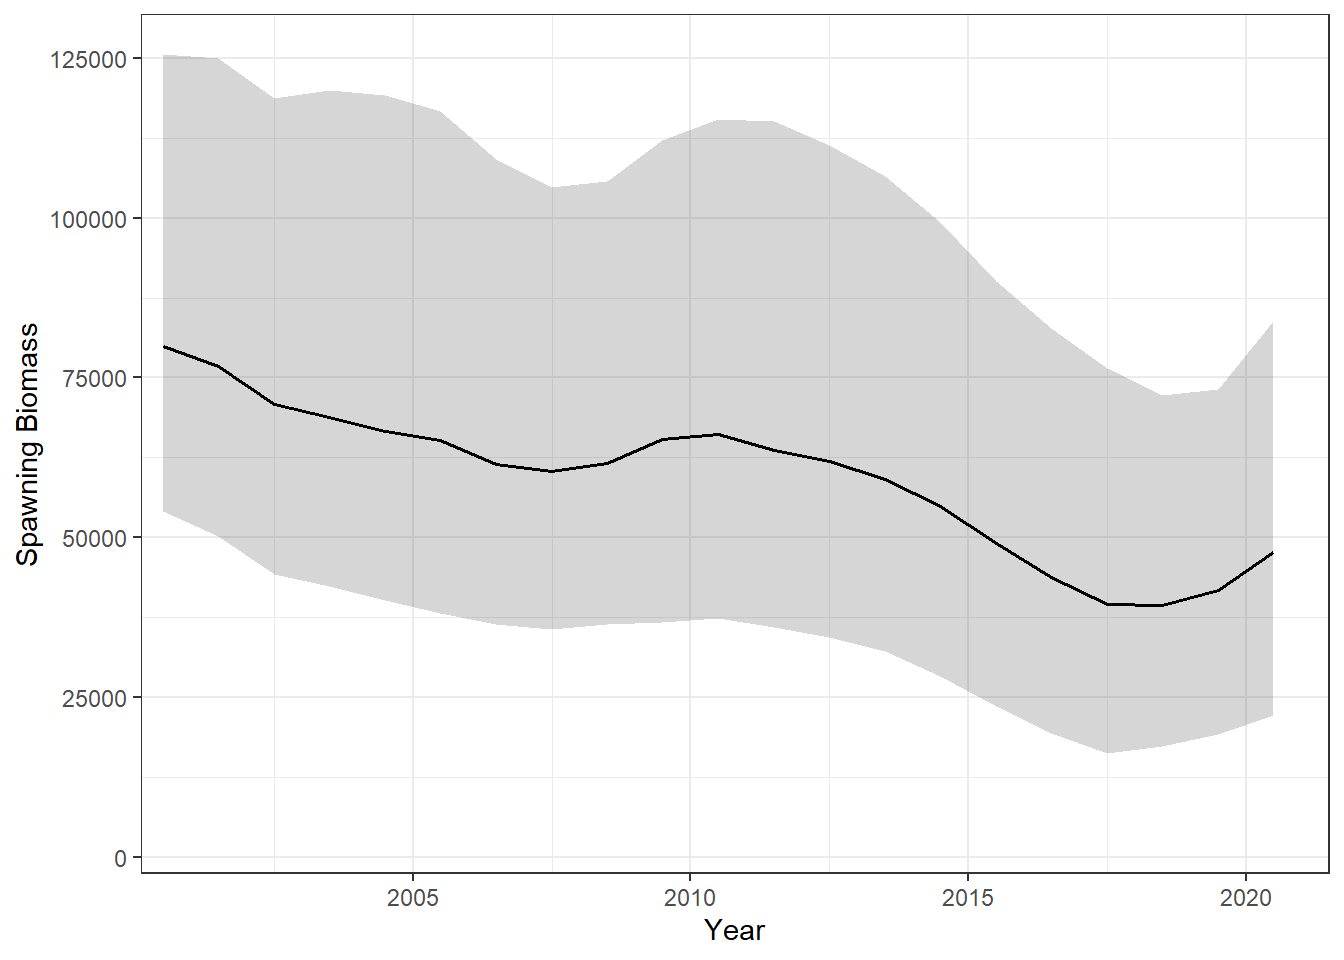
OM5a. Black line is the median and the grey ribbon the 5th–95th percentile interval across simulations.
The figures below show the historical dynamics of the Robustness OM OM5a:
In each figure, the black line shows the median across simulations and the grey ribbon the 5th–95th percentile interval.
OM5a. Black line is the median and the grey ribbon the 5th–95th percentile interval across simulations.
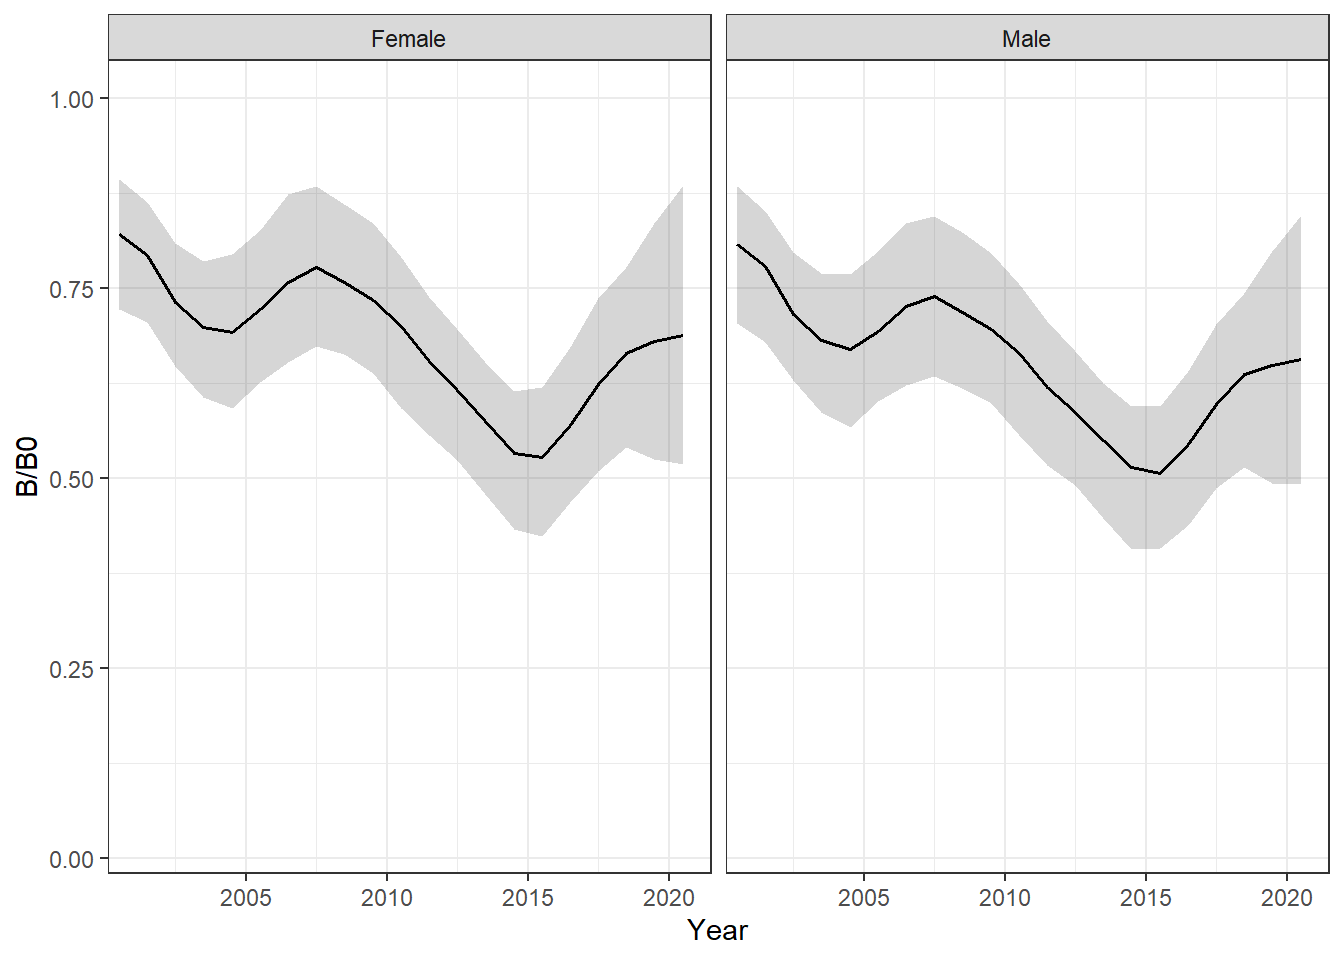
OM5a. Black line is the median and the grey ribbon the 5th–95th percentile interval across simulations.
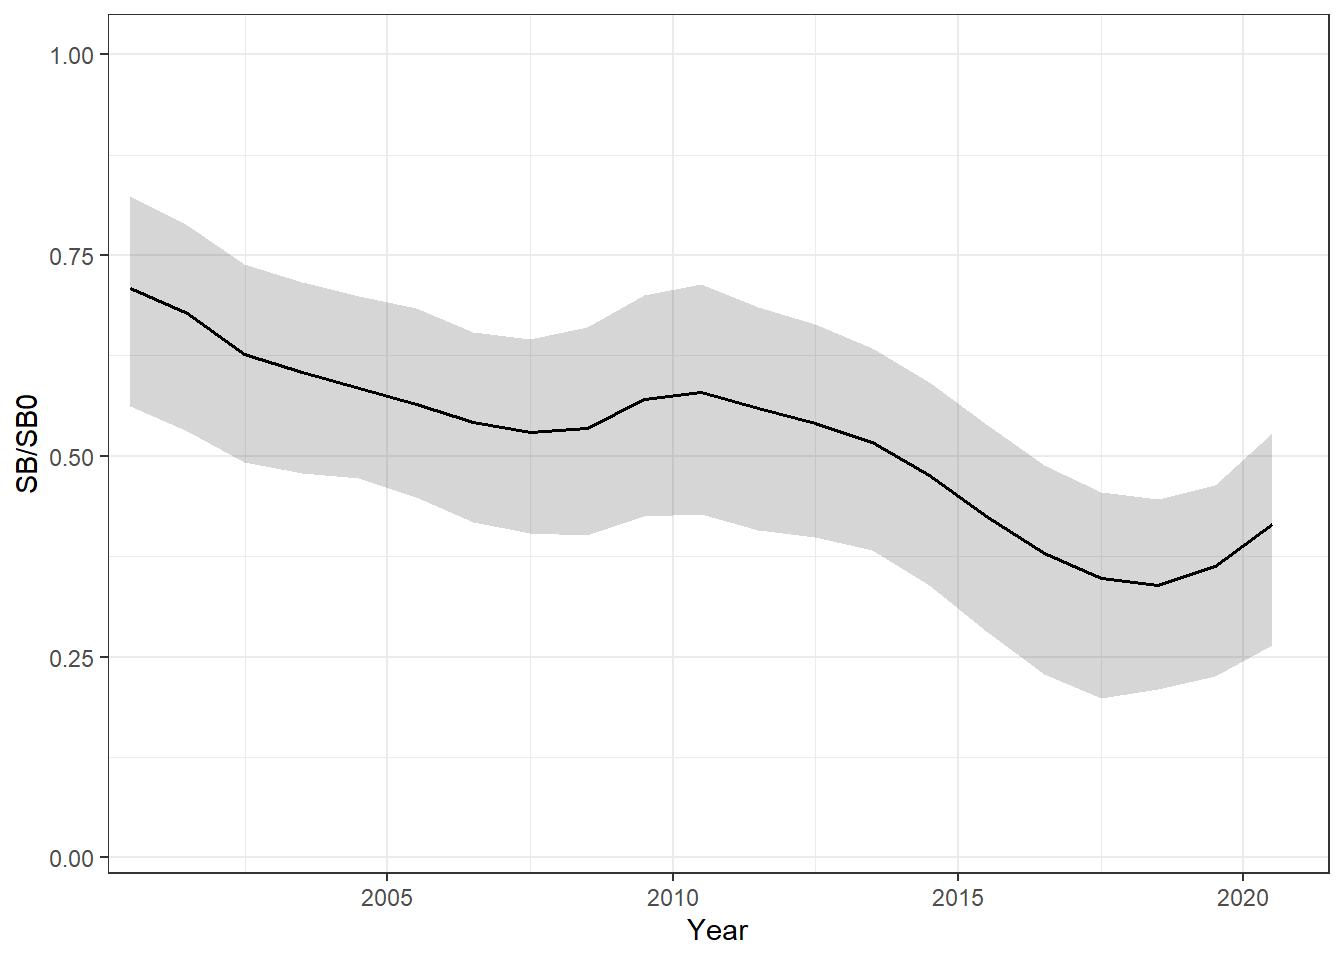
OM5a. Black line is the median and the grey ribbon the 5th–95th percentile interval across simulations.
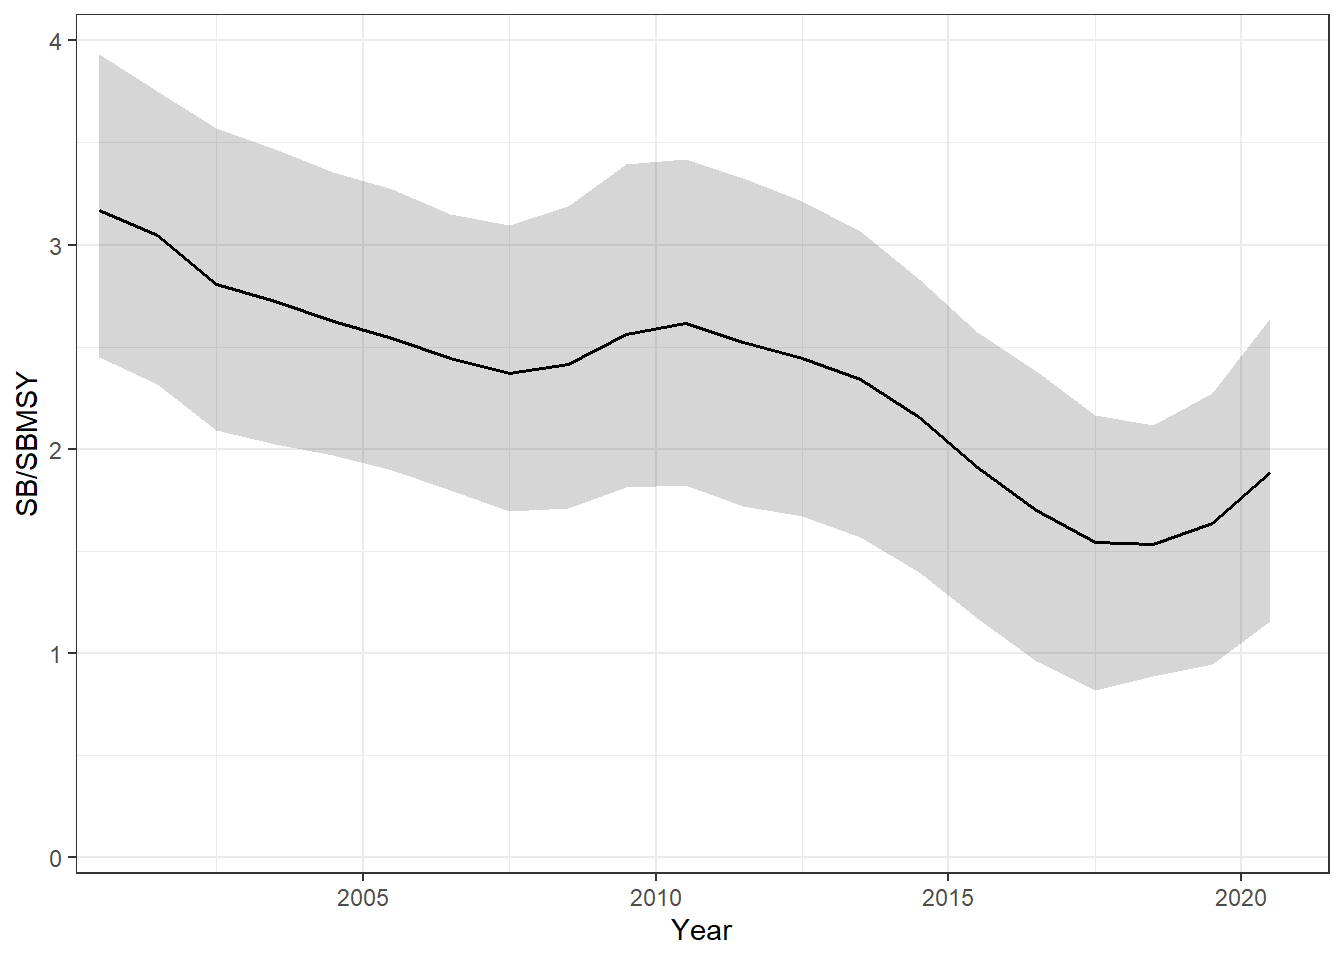
OM5a. Black line is the median and the grey ribbon the 5th–95th percentile interval across simulations.
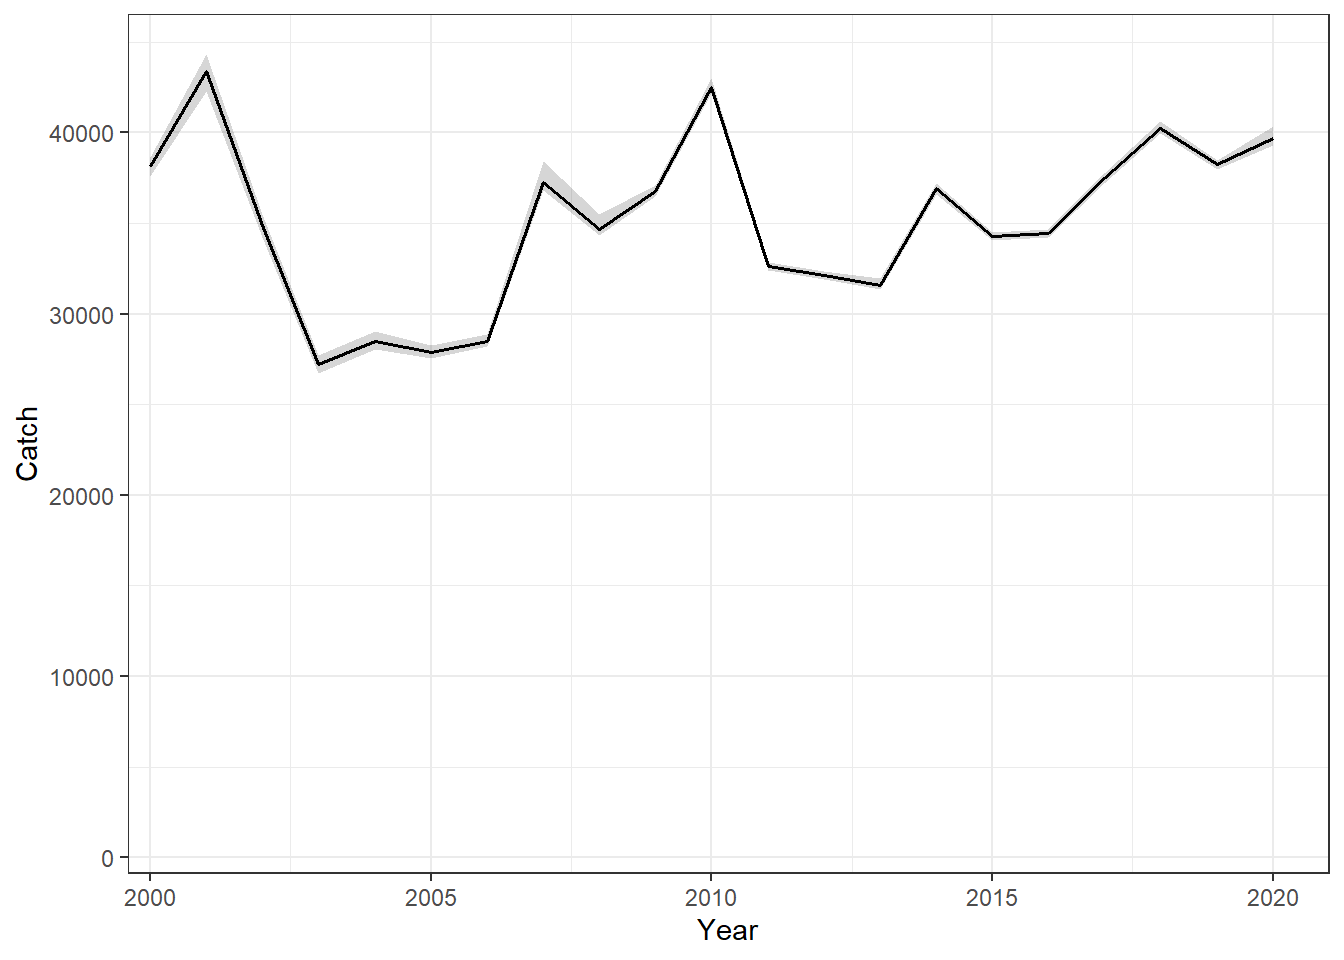
OM5a. Black line is the median and the grey ribbon the 5th–95th percentile interval across simulations.
The figures below show the historical dynamics of the Robustness OM OM6b:
In each figure, the black line shows the median across simulations and the grey ribbon the 5th–95th percentile interval. The relative biomass plots are faceted by stock, as depletion cannot be meaningfully summed across stocks.
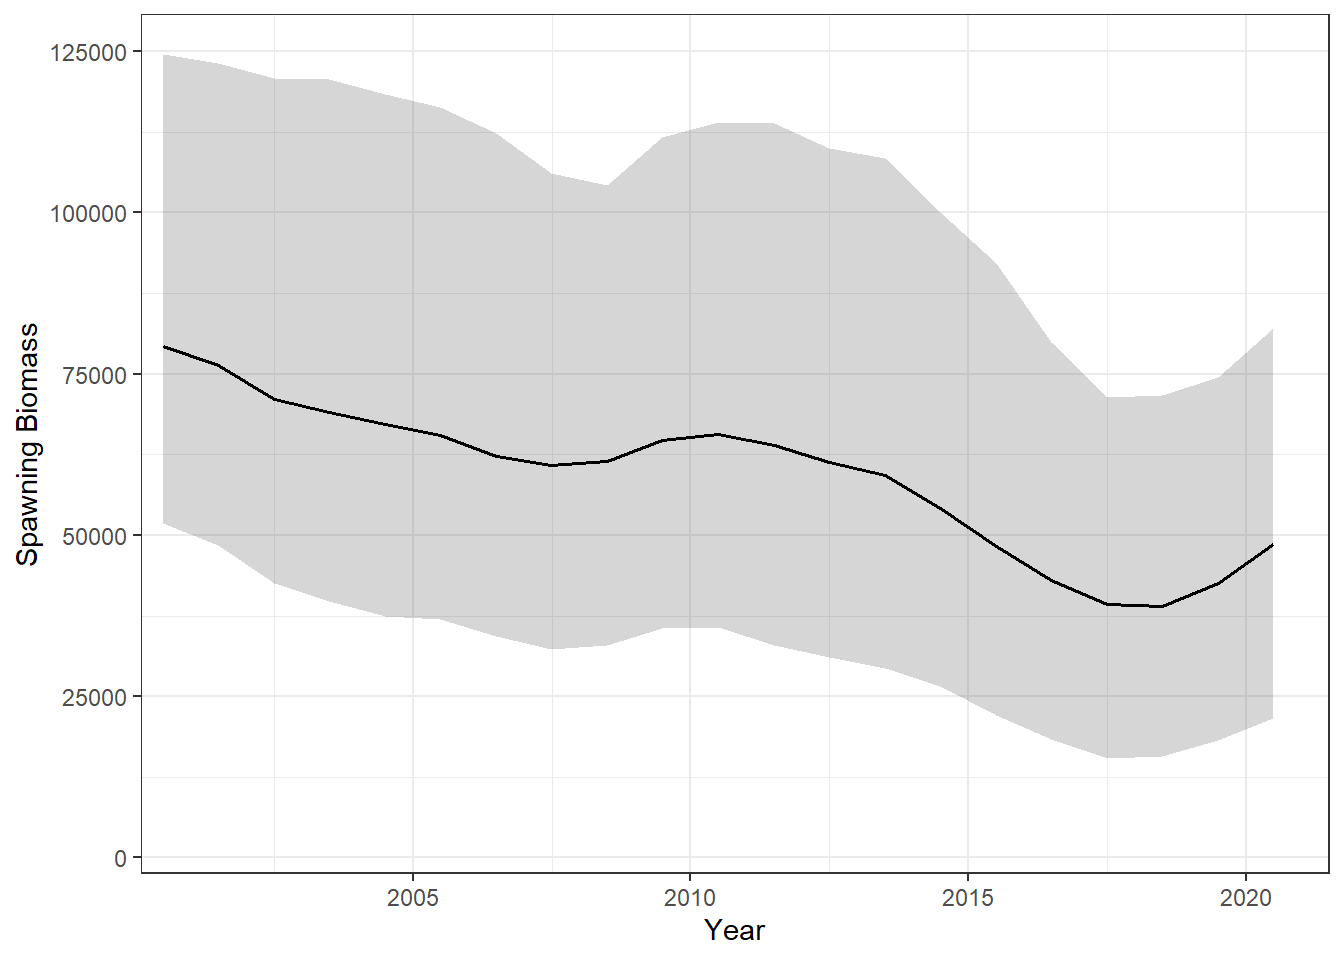
OM6b. Black line is the median and the grey ribbon the 5th–95th percentile interval across simulations.
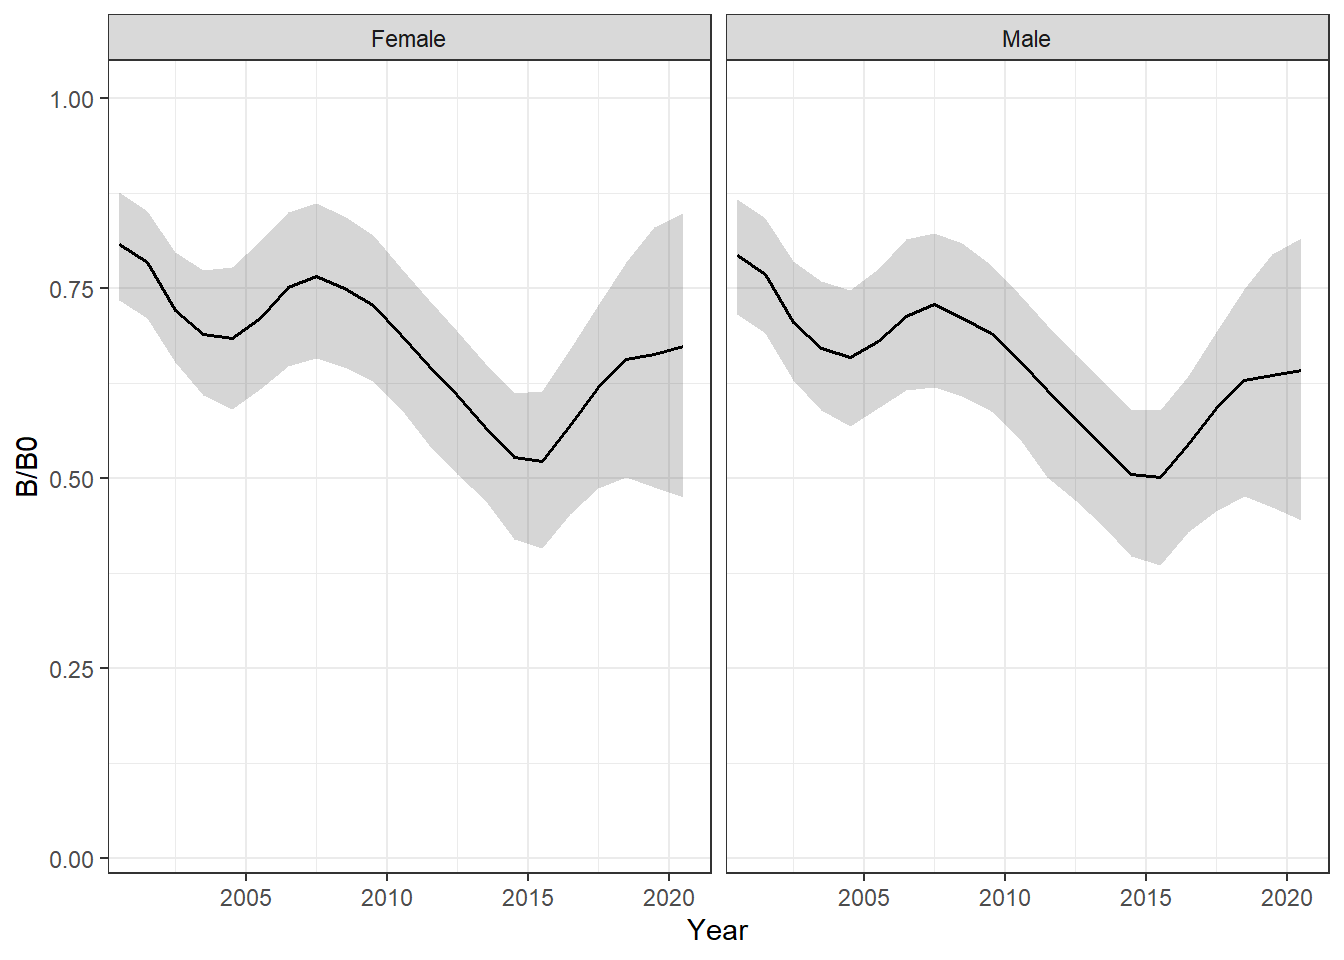
OM6b. Black line is the median and the grey ribbon the 5th–95th percentile interval across simulations.
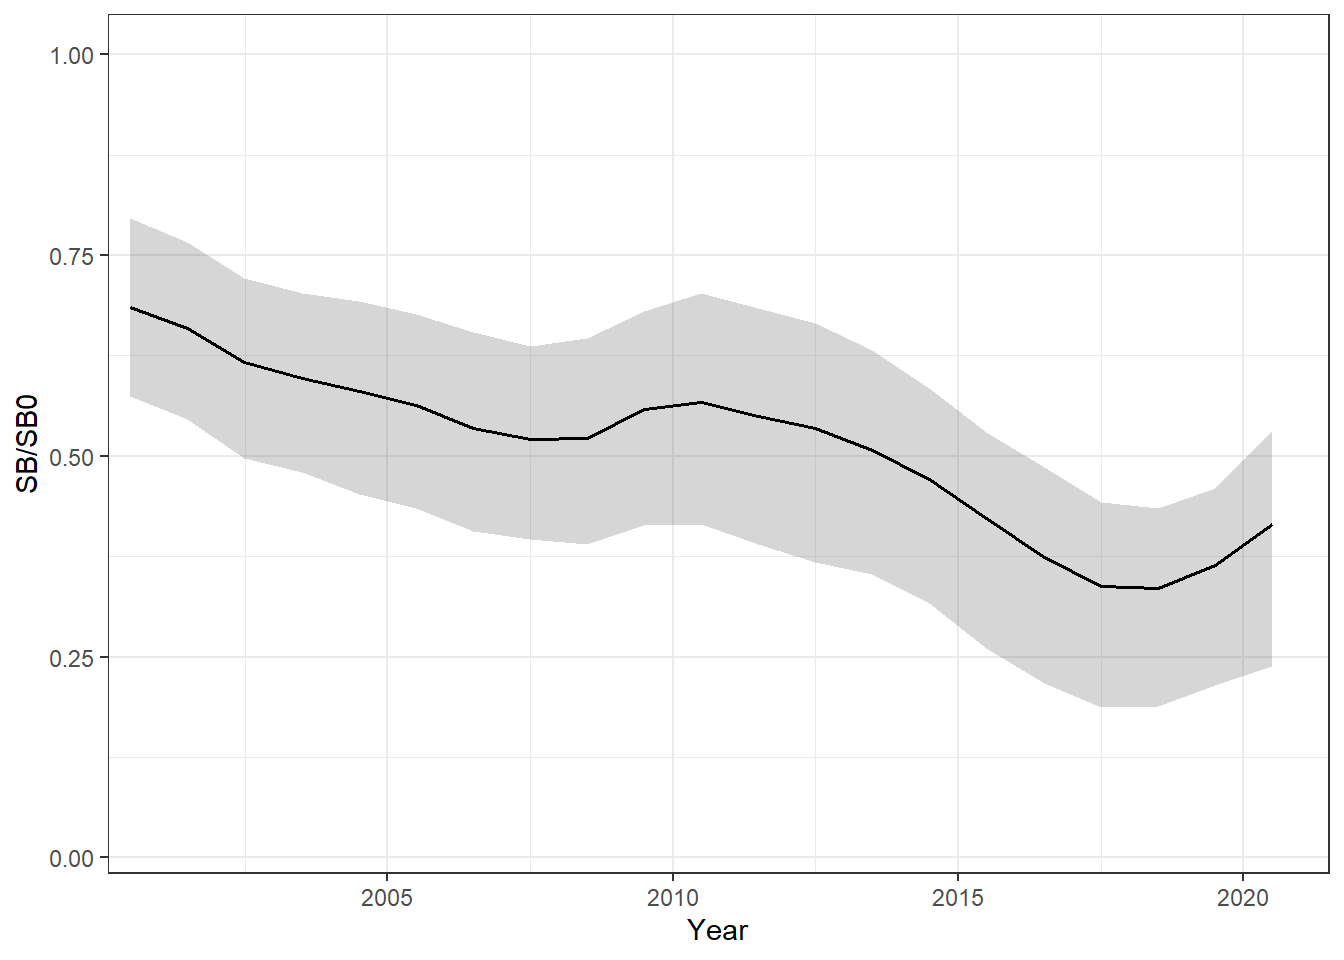
OM6b. Black line is the median and the grey ribbon the 5th–95th percentile interval across simulations.
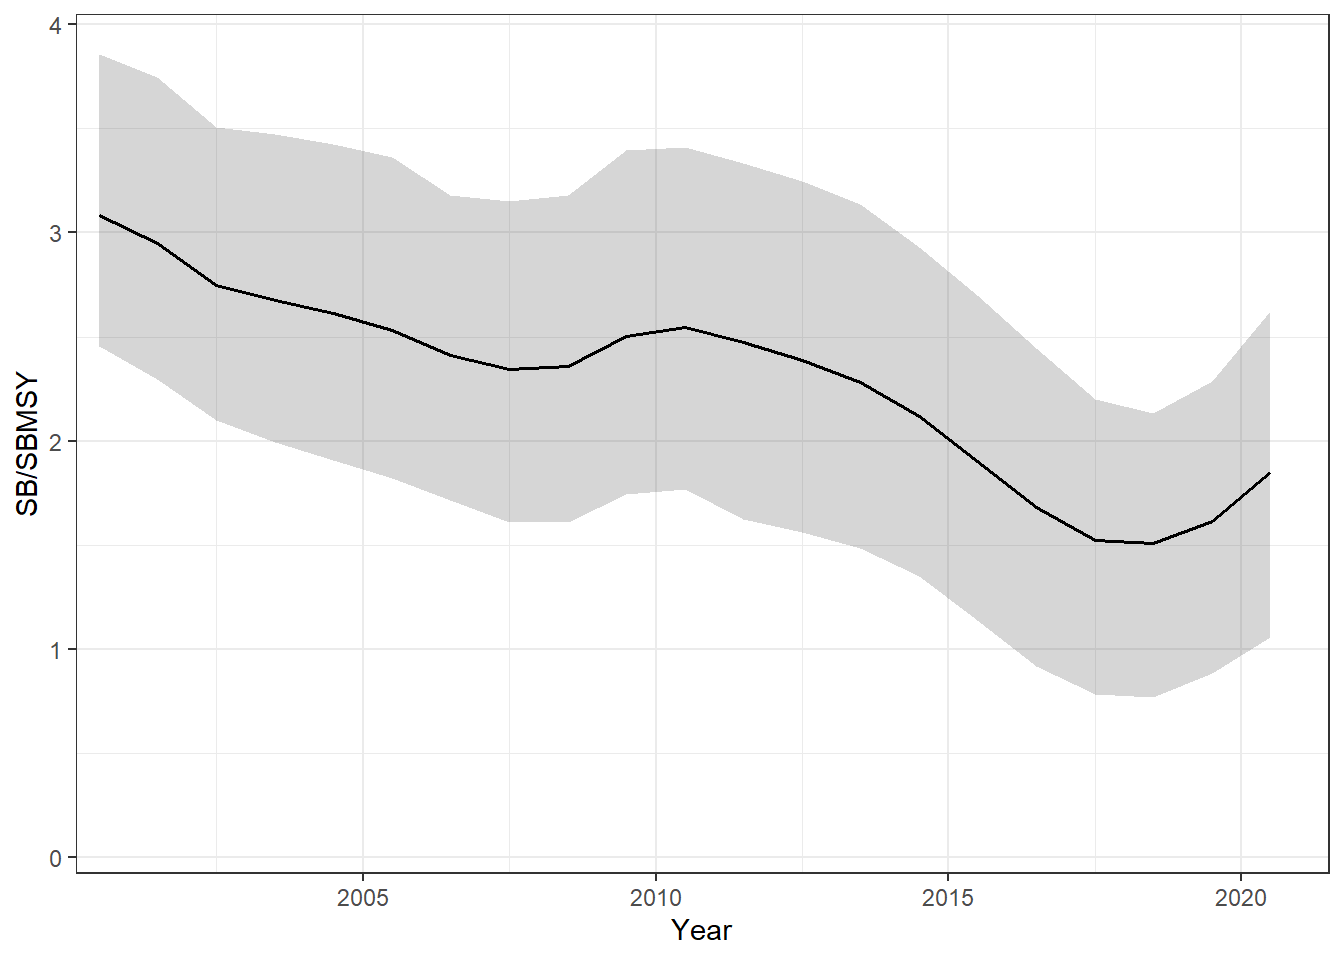
OM6b. Black line is the median and the grey ribbon the 5th–95th percentile interval across simulations.
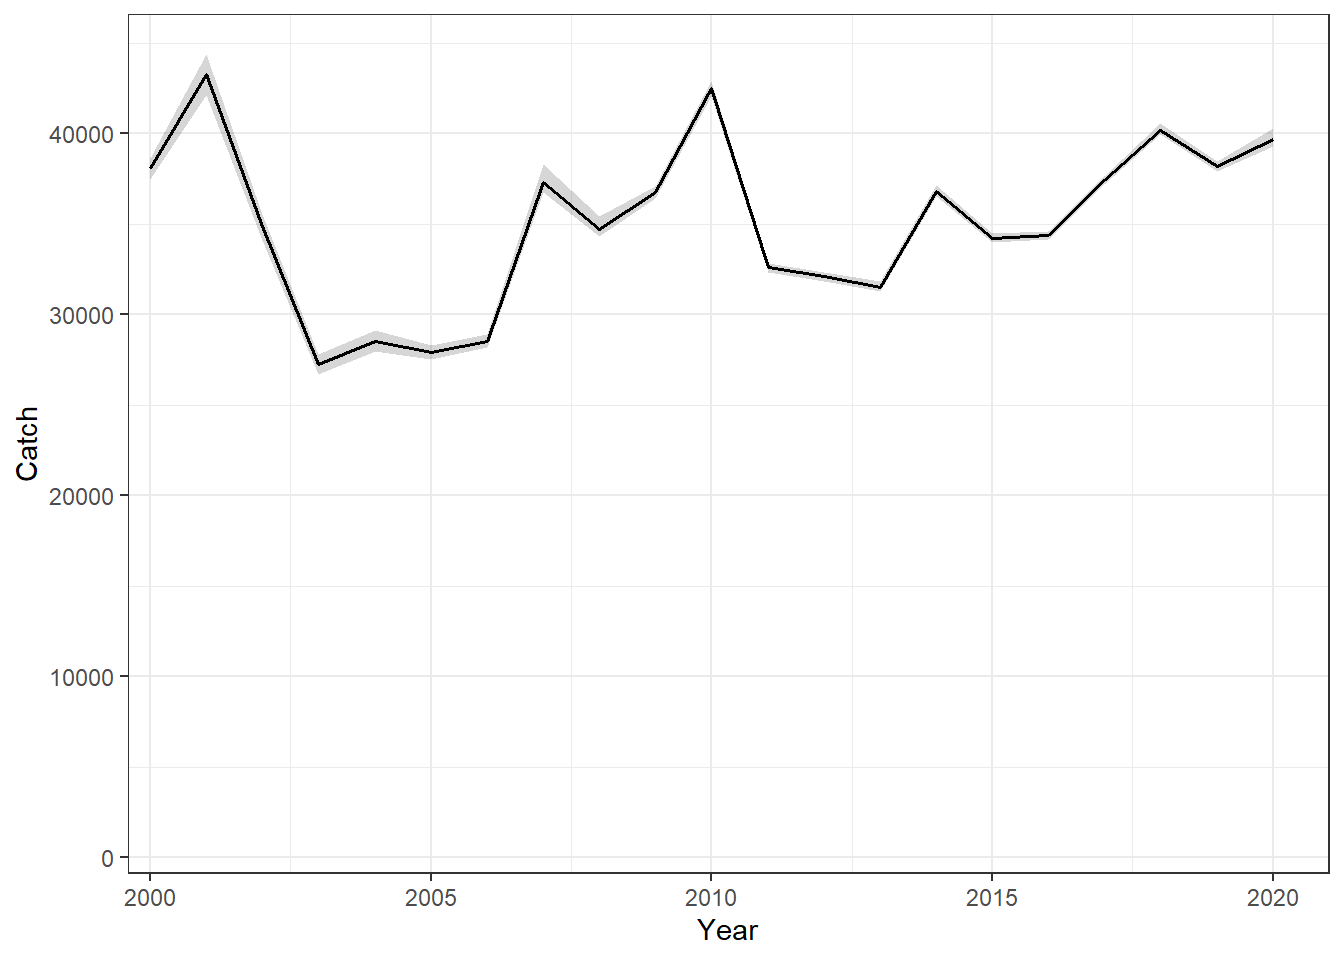
OM6b. Black line is the median and the grey ribbon the 5th–95th percentile interval across simulations.