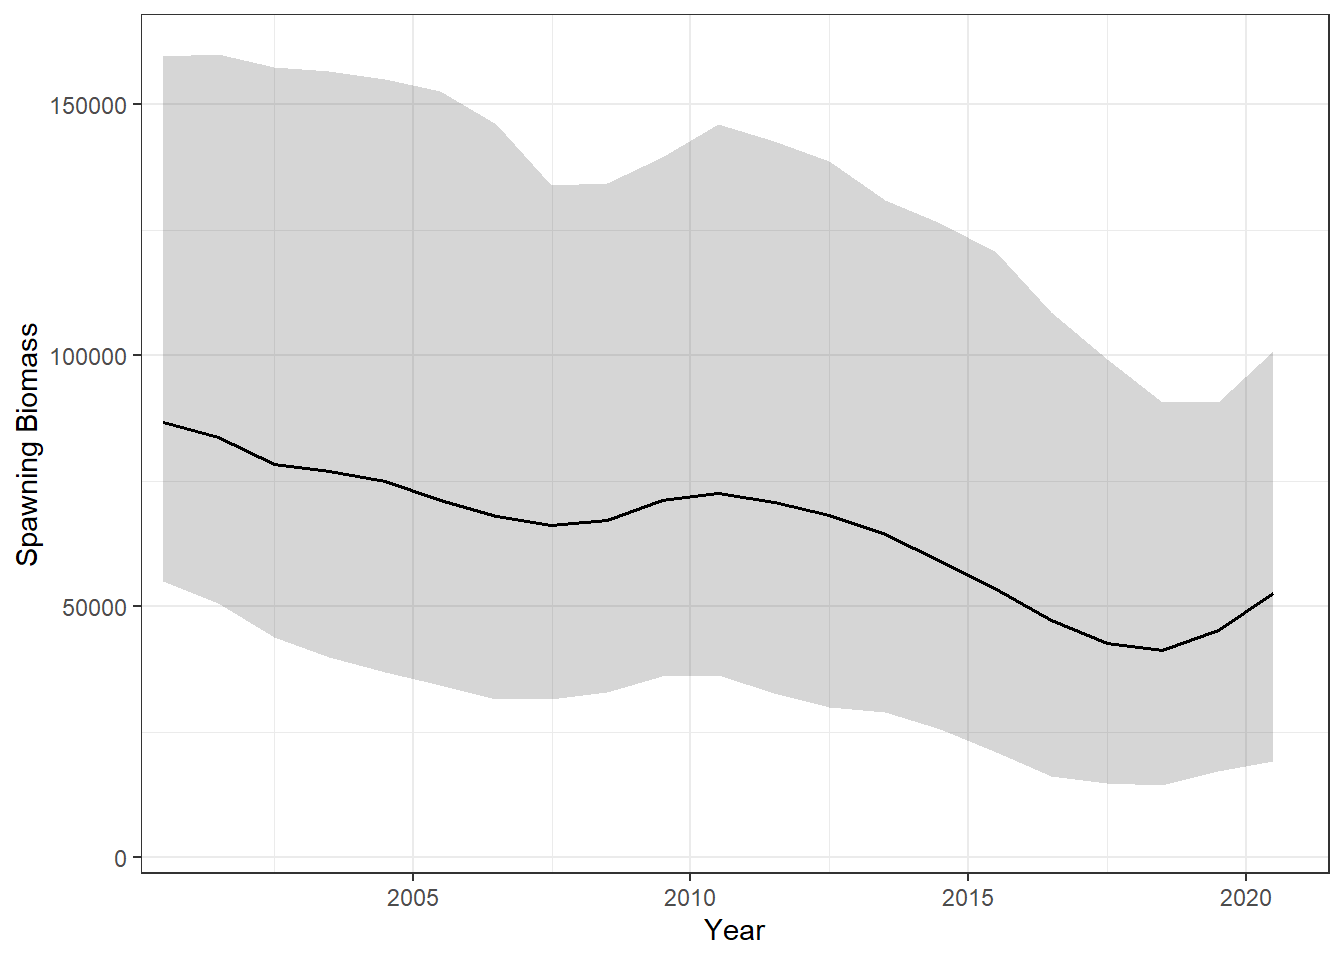
OM5b. Black line is the median and the grey ribbon the 5th–95th percentile interval across simulations.
The Base case OM (OM5b) uses the LL1 (NW) CPUE series as the index of abundance as the primary data used in the OM conditioning (see Chapter 2).
The figures below show the historical dynamics of the OM5b, the Base Case OM:
In each figure, the black line shows the median across simulations and the grey ribbon the 5th–95th percentile interval.
OM5b. Black line is the median and the grey ribbon the 5th–95th percentile interval across simulations.
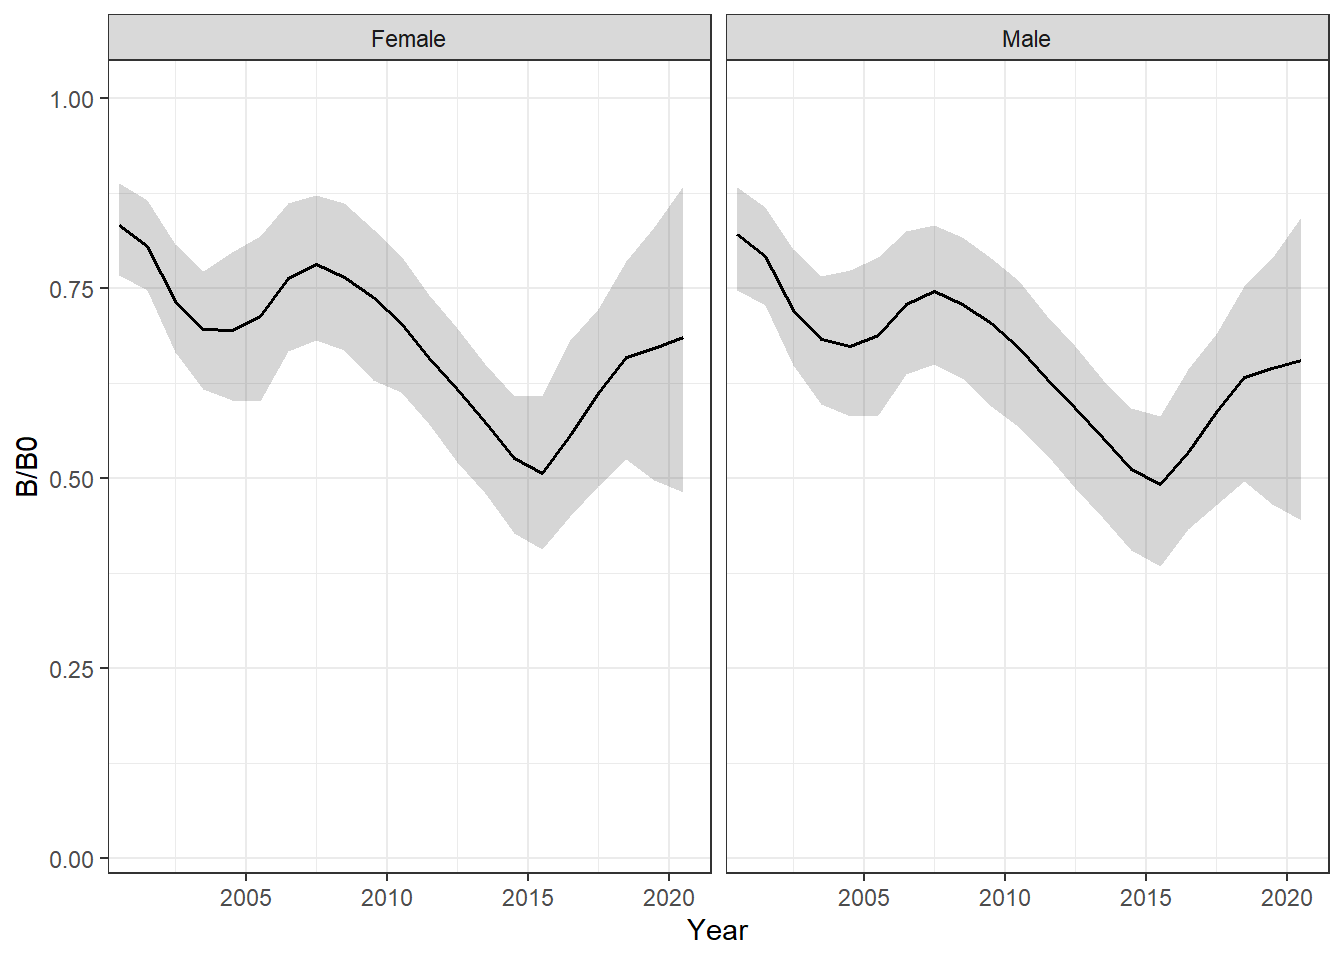
OM5b. Black line is the median and the grey ribbon the 5th–95th percentile interval across simulations.
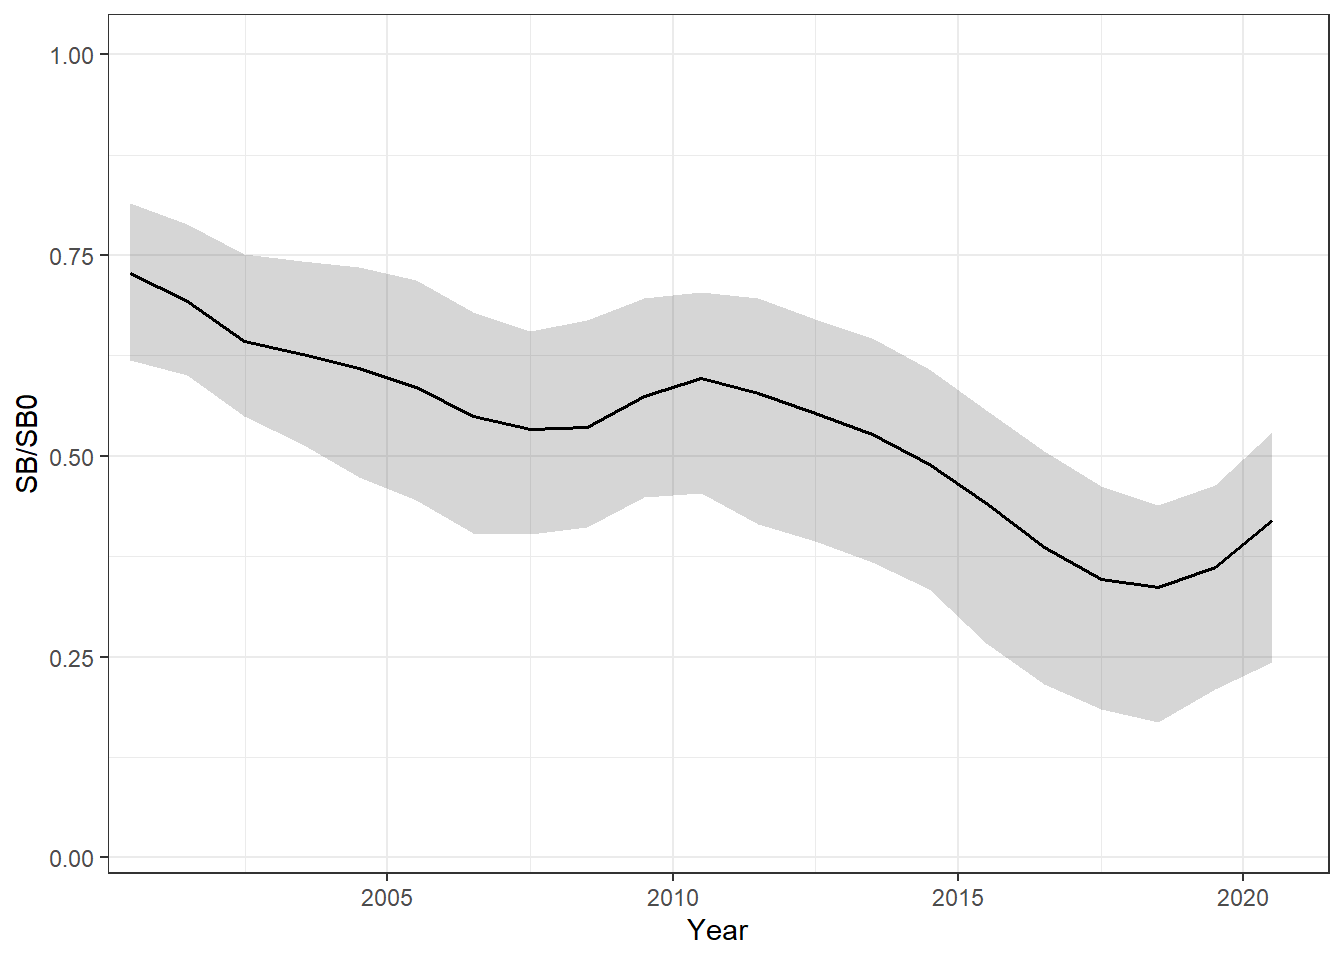
OM5b. Black line is the median and the grey ribbon the 5th–95th percentile interval across simulations.
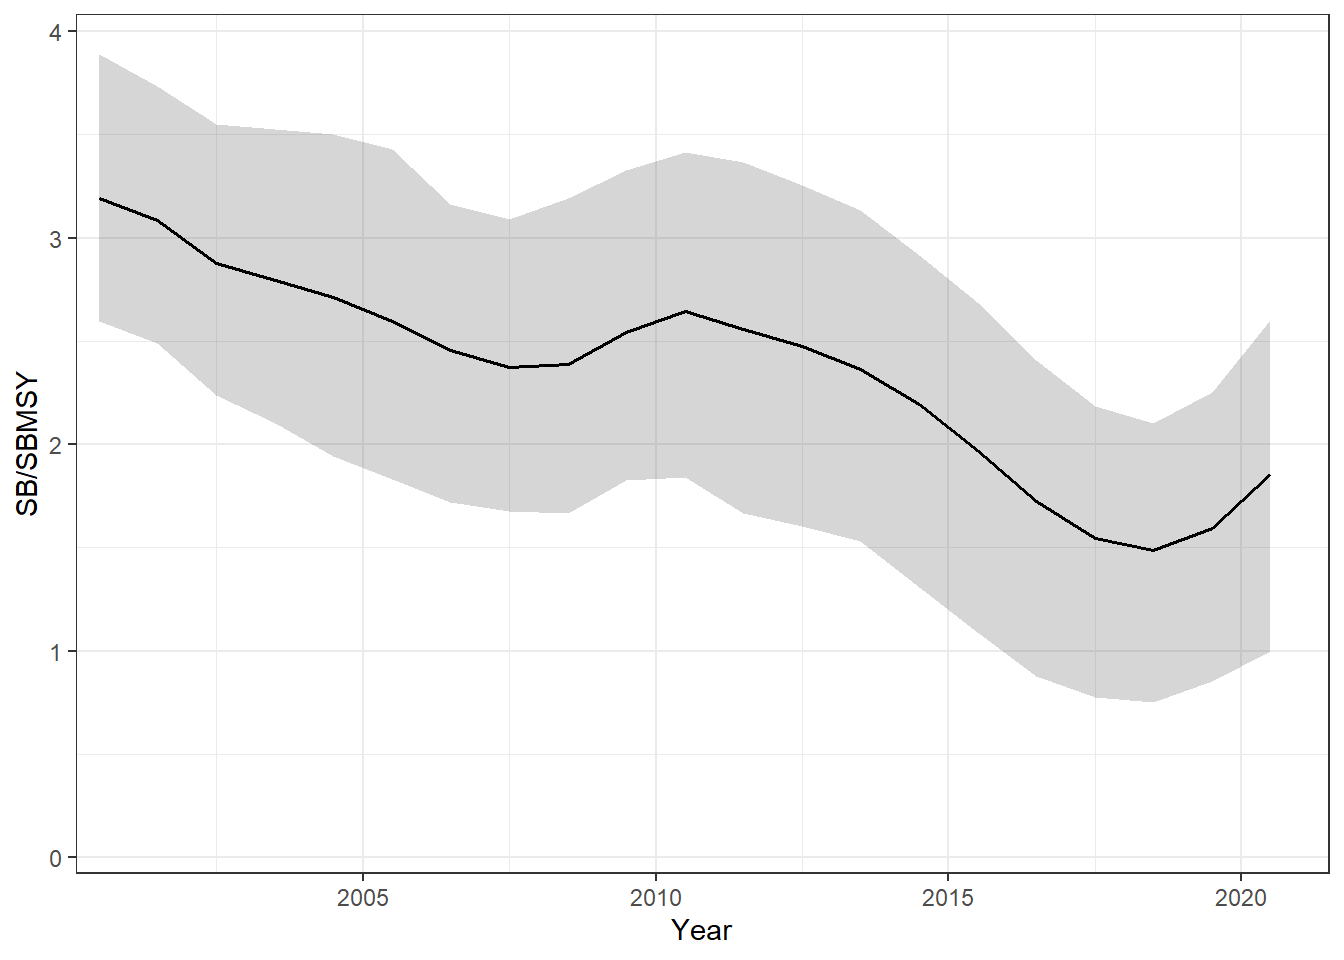
OM5b. Black line is the median and the grey ribbon the 5th–95th percentile interval across simulations.
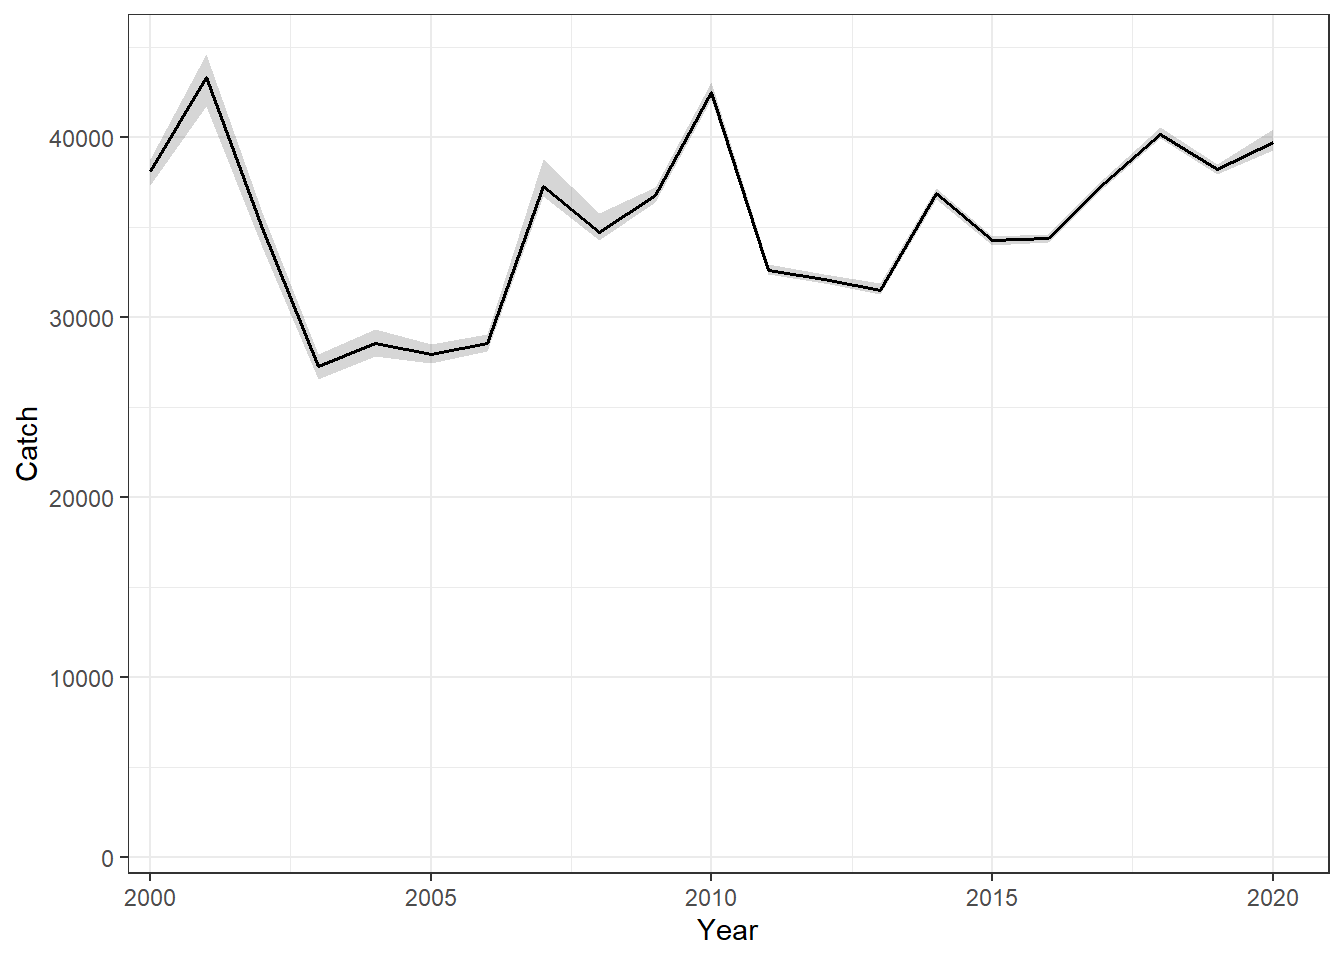
OM5b. Black line is the median and the grey ribbon the 5th–95th percentile interval across simulations.
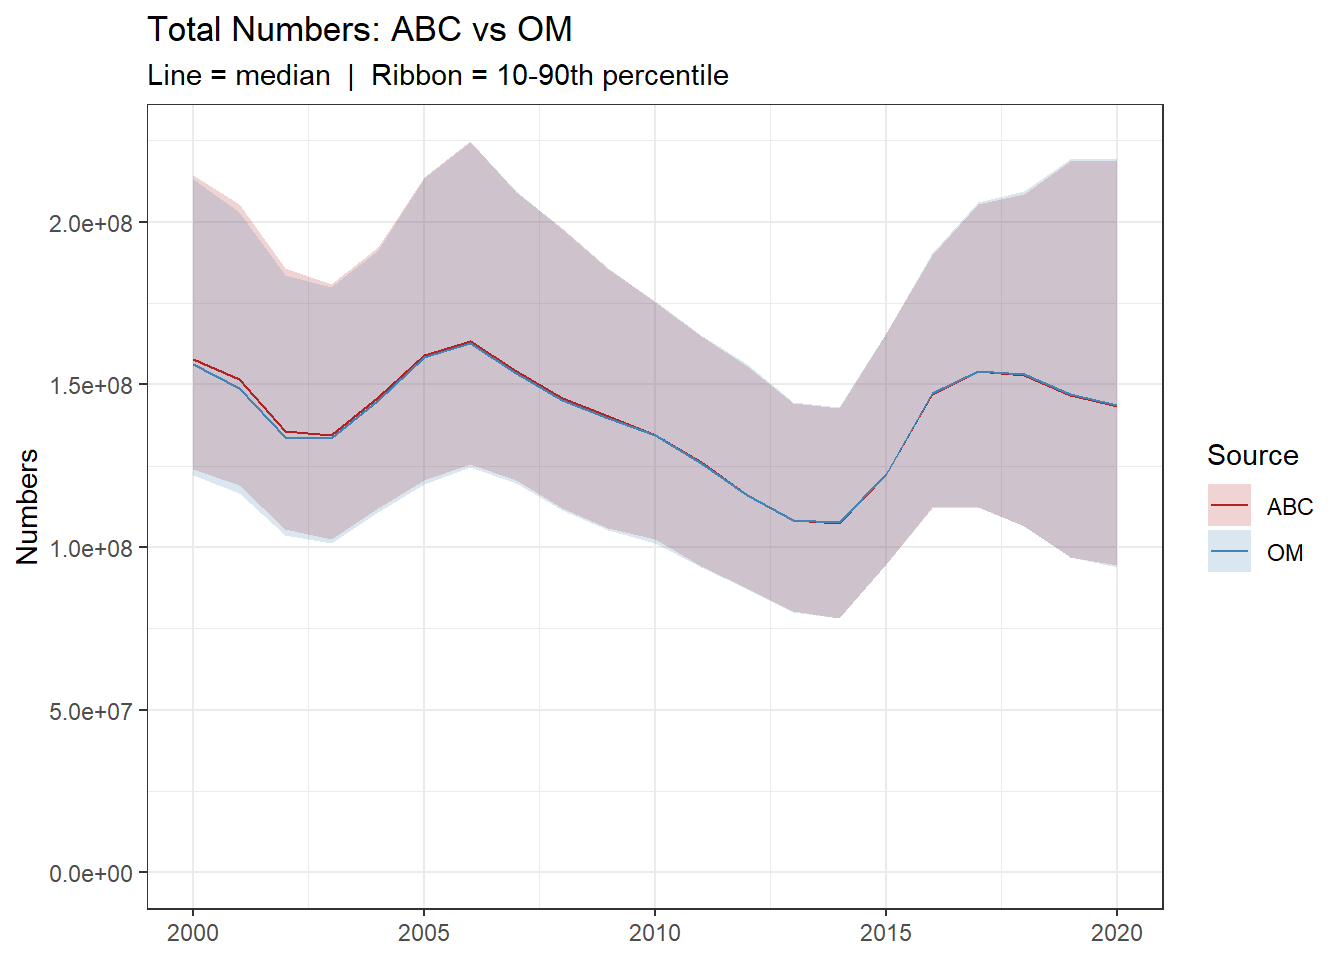
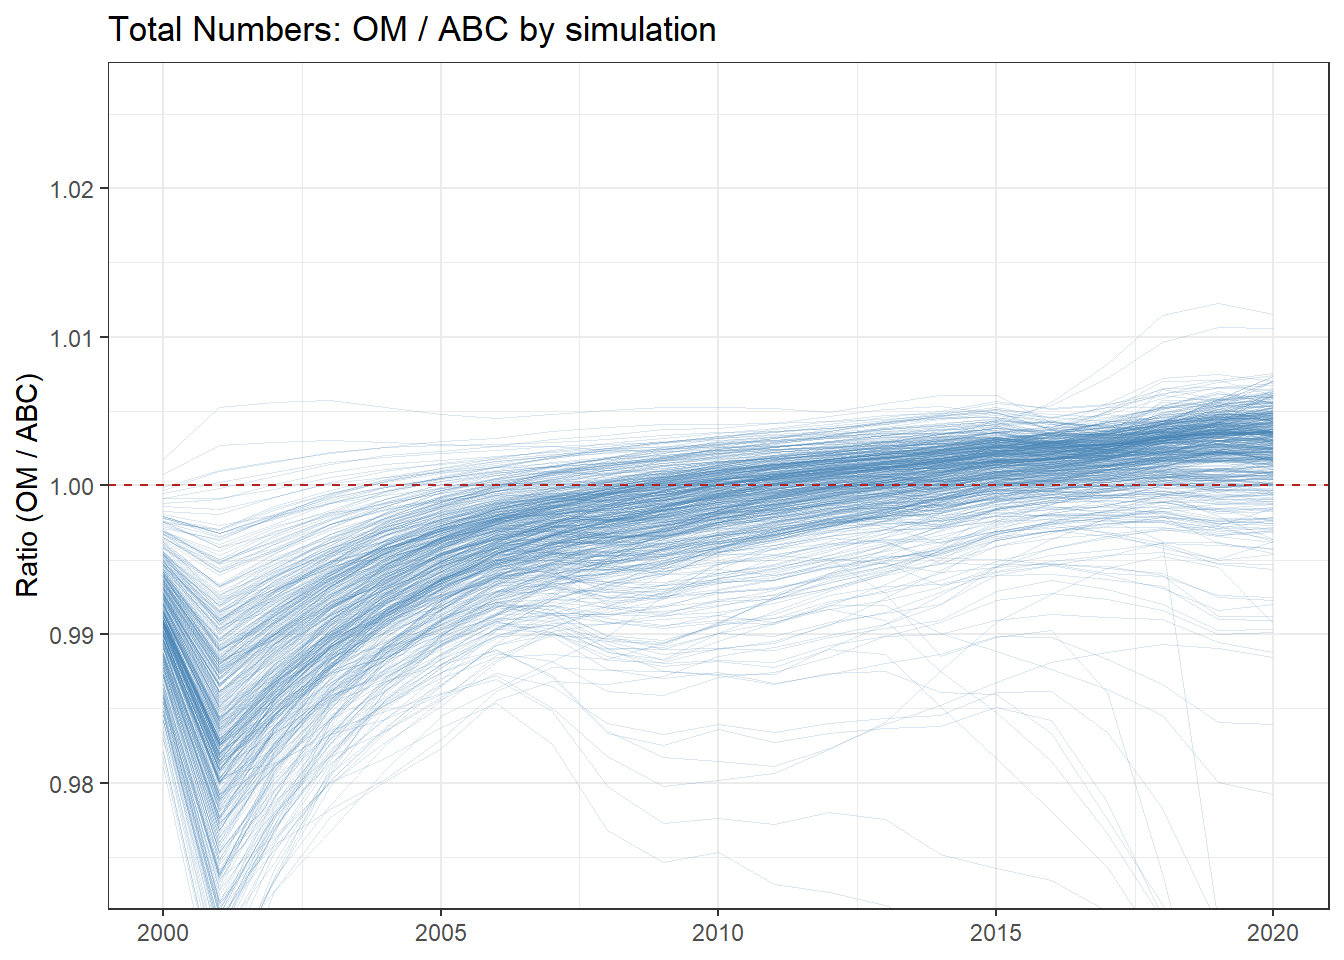
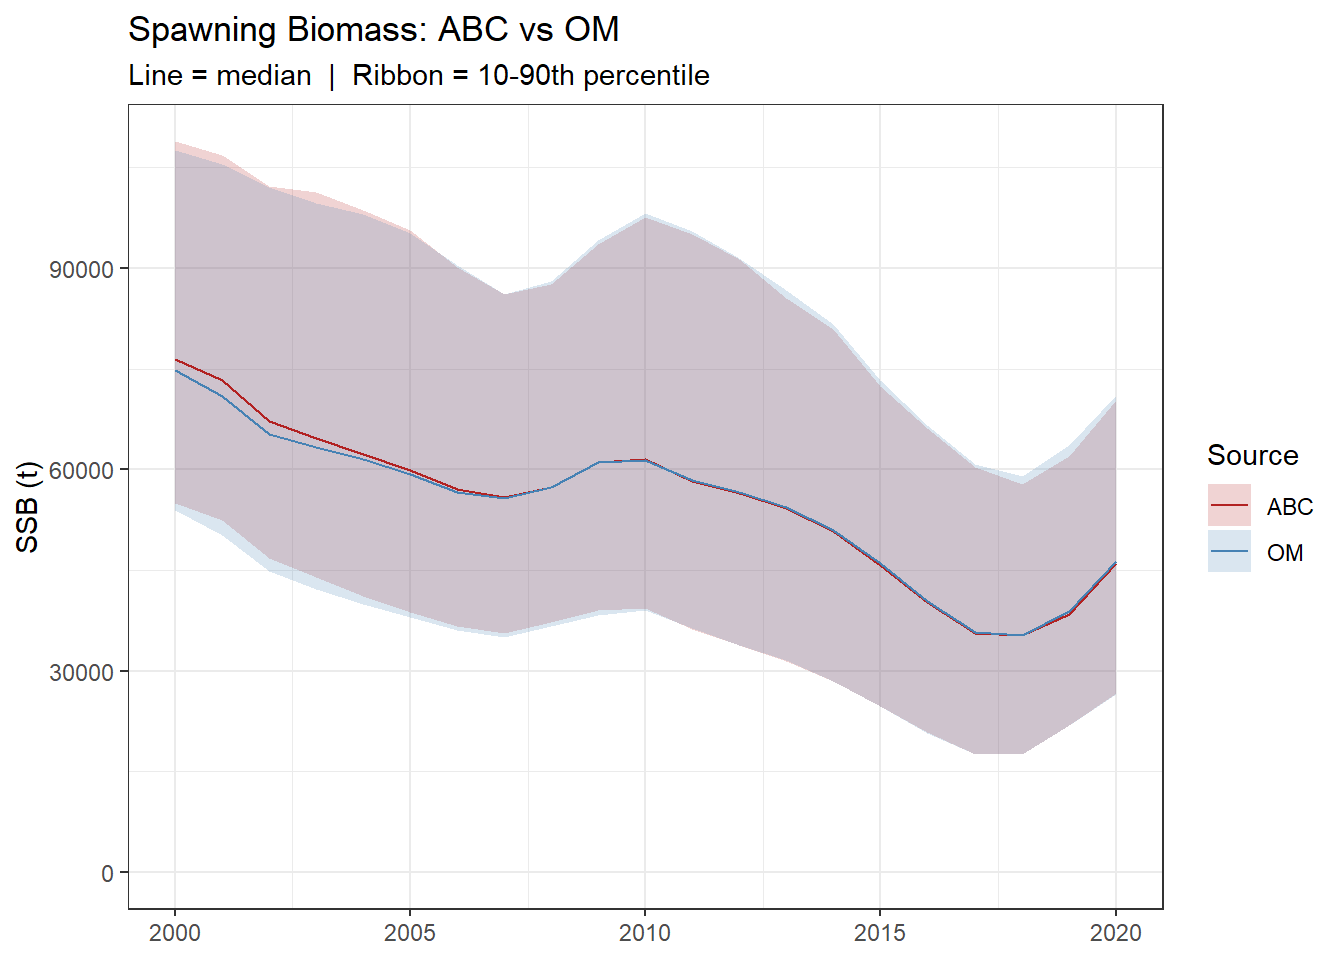
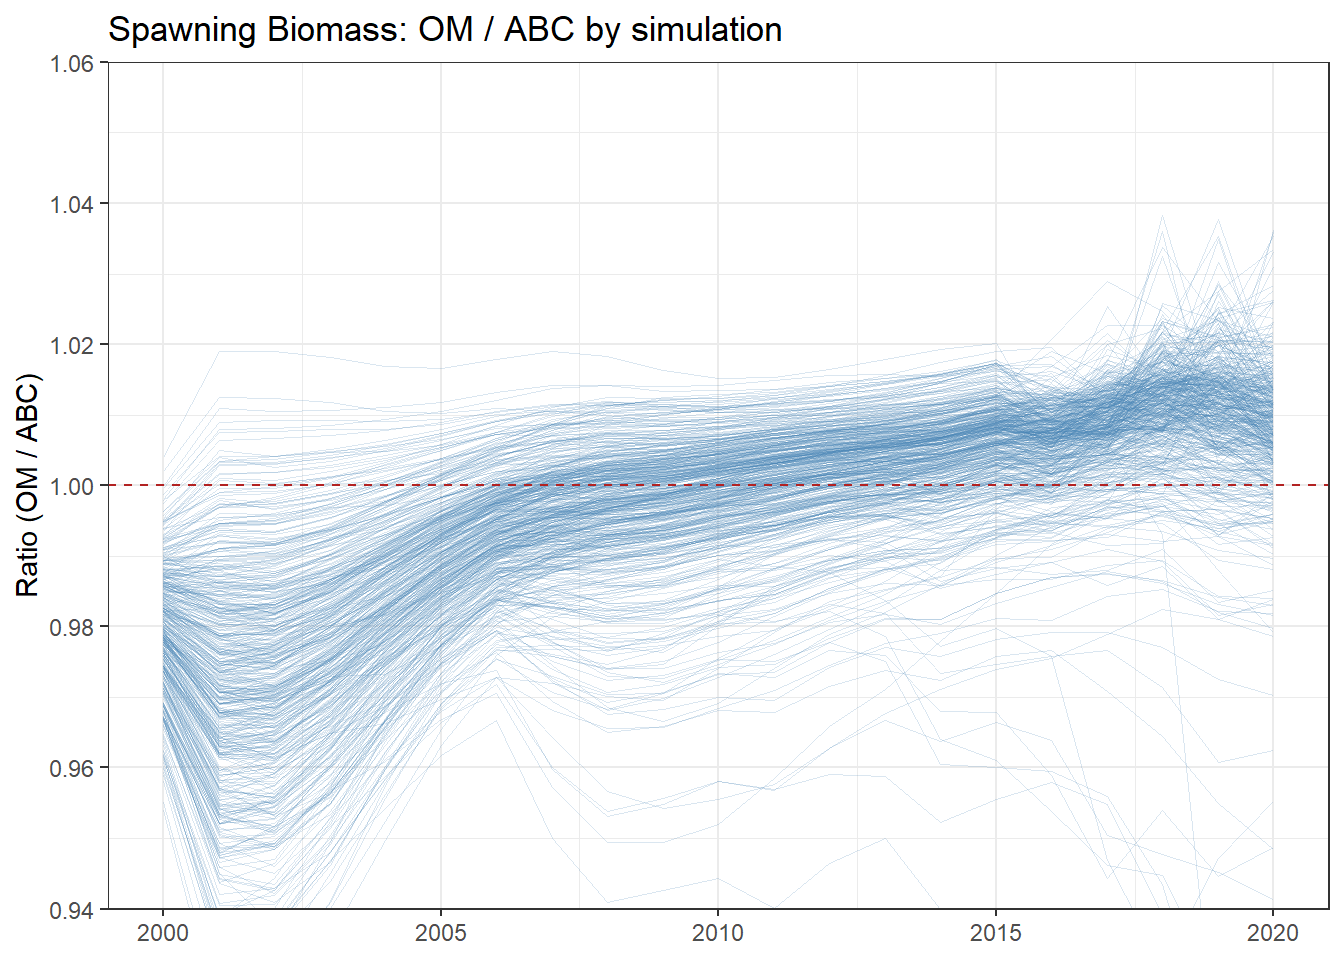
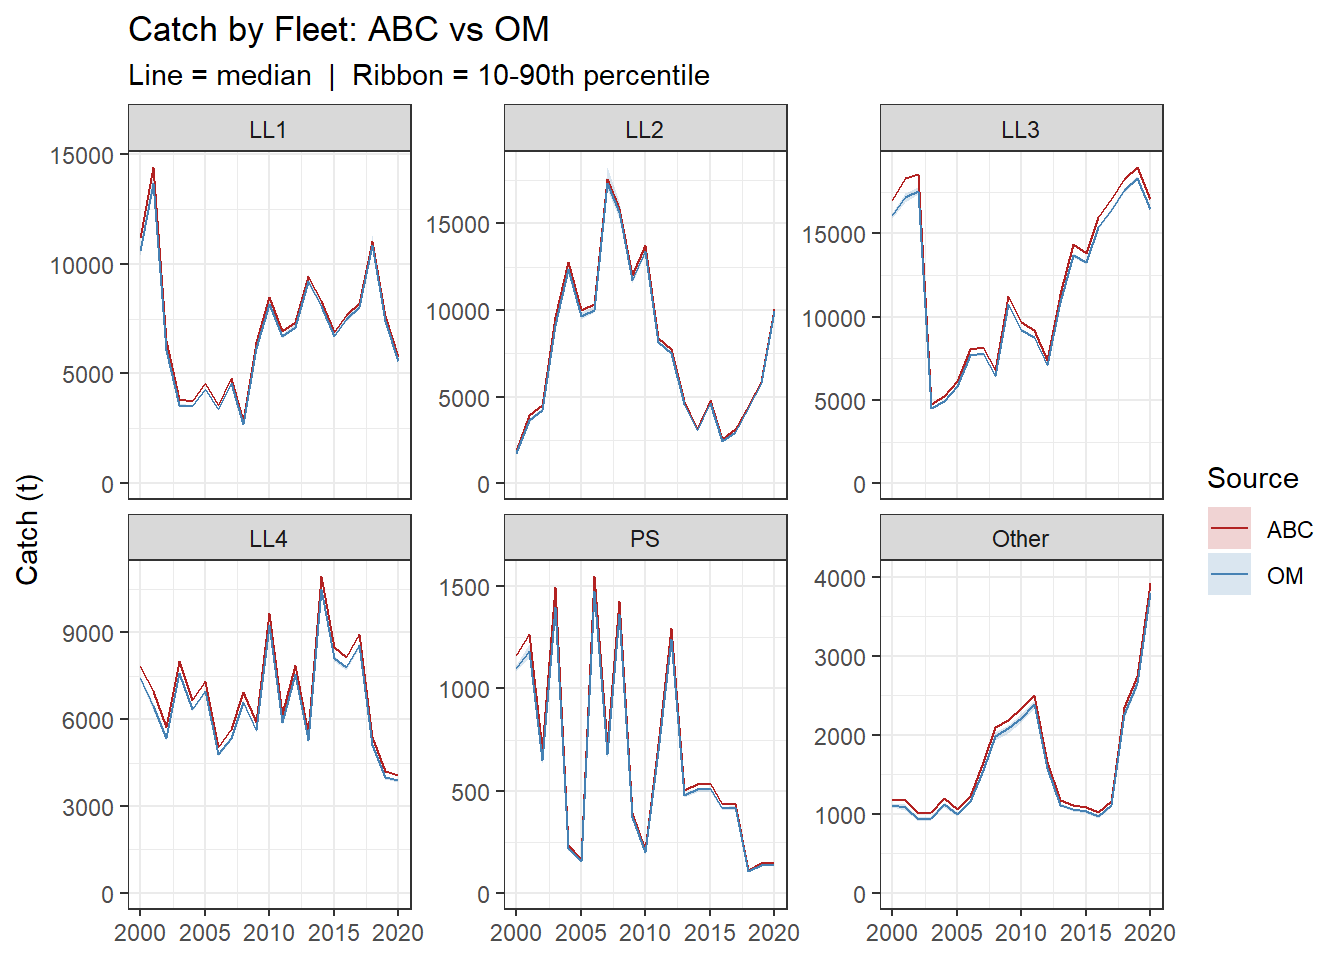
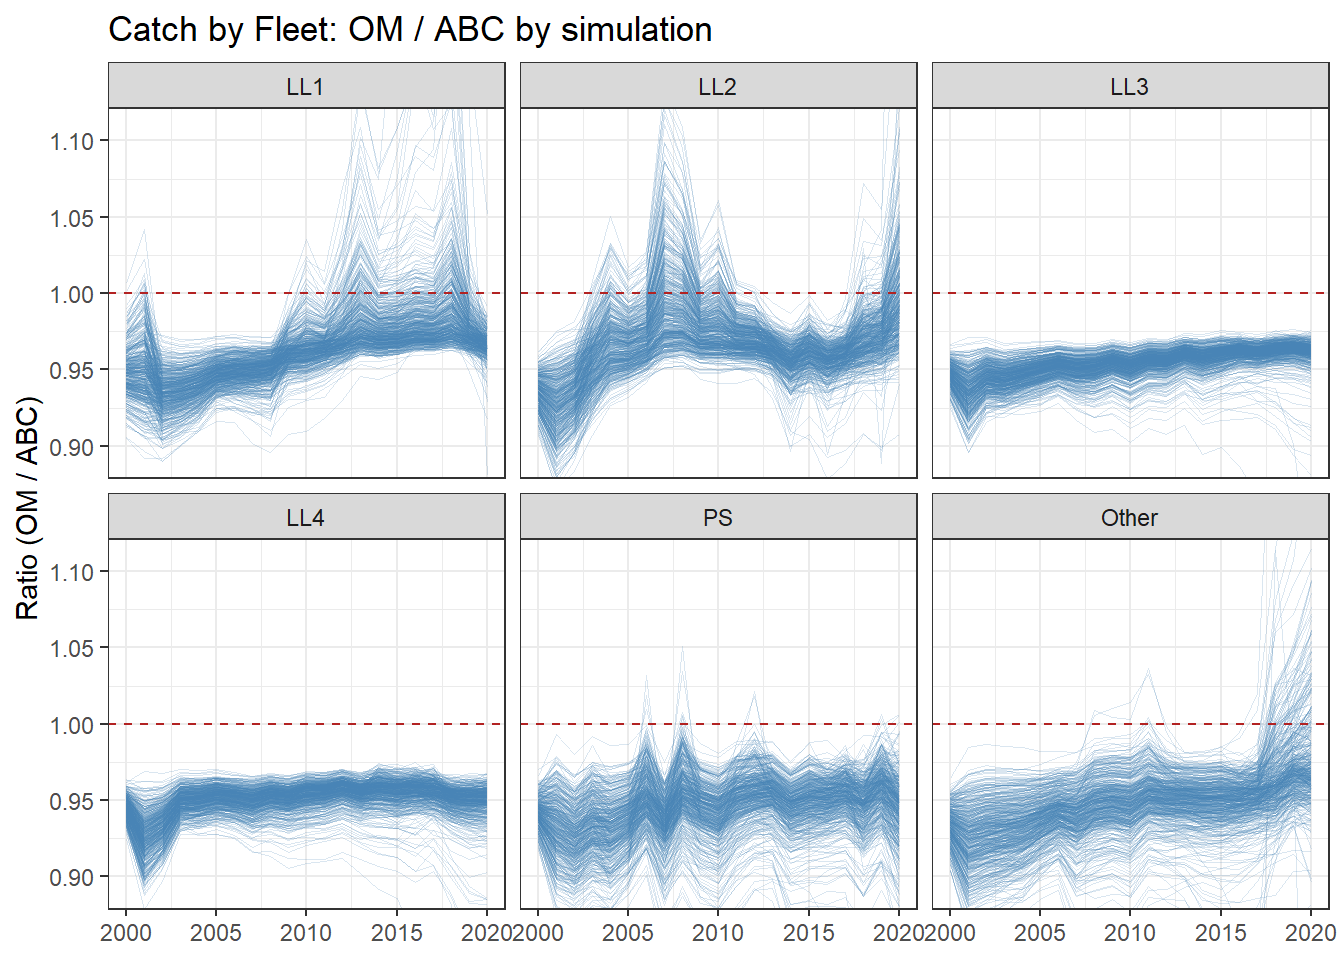
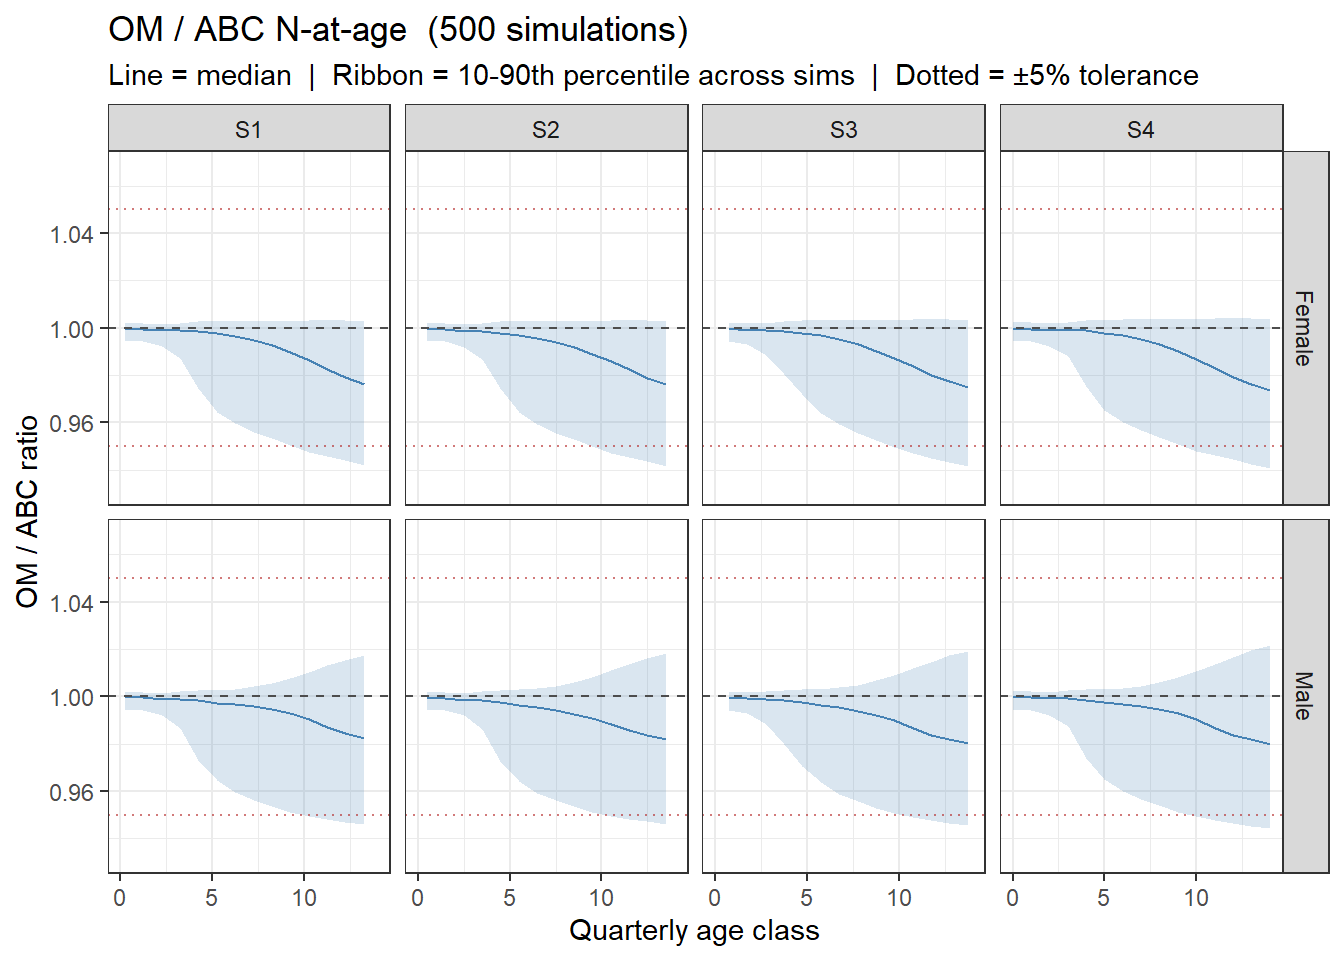
The figures below compare the Base Case OM dynamics against the ABC conditioning model across 500 MCMC simulations. In each ribbon plot, the line shows the posterior median and the shaded band the 10th–90th percentile interval for the ABC model (red) and the OM (blue). The ratio plots show OM / ABC for each individual simulation, with the dashed red line at 1 indicating perfect agreement.